Overlay Comparison
Stack multiple pitches to compare trajectories
Overview
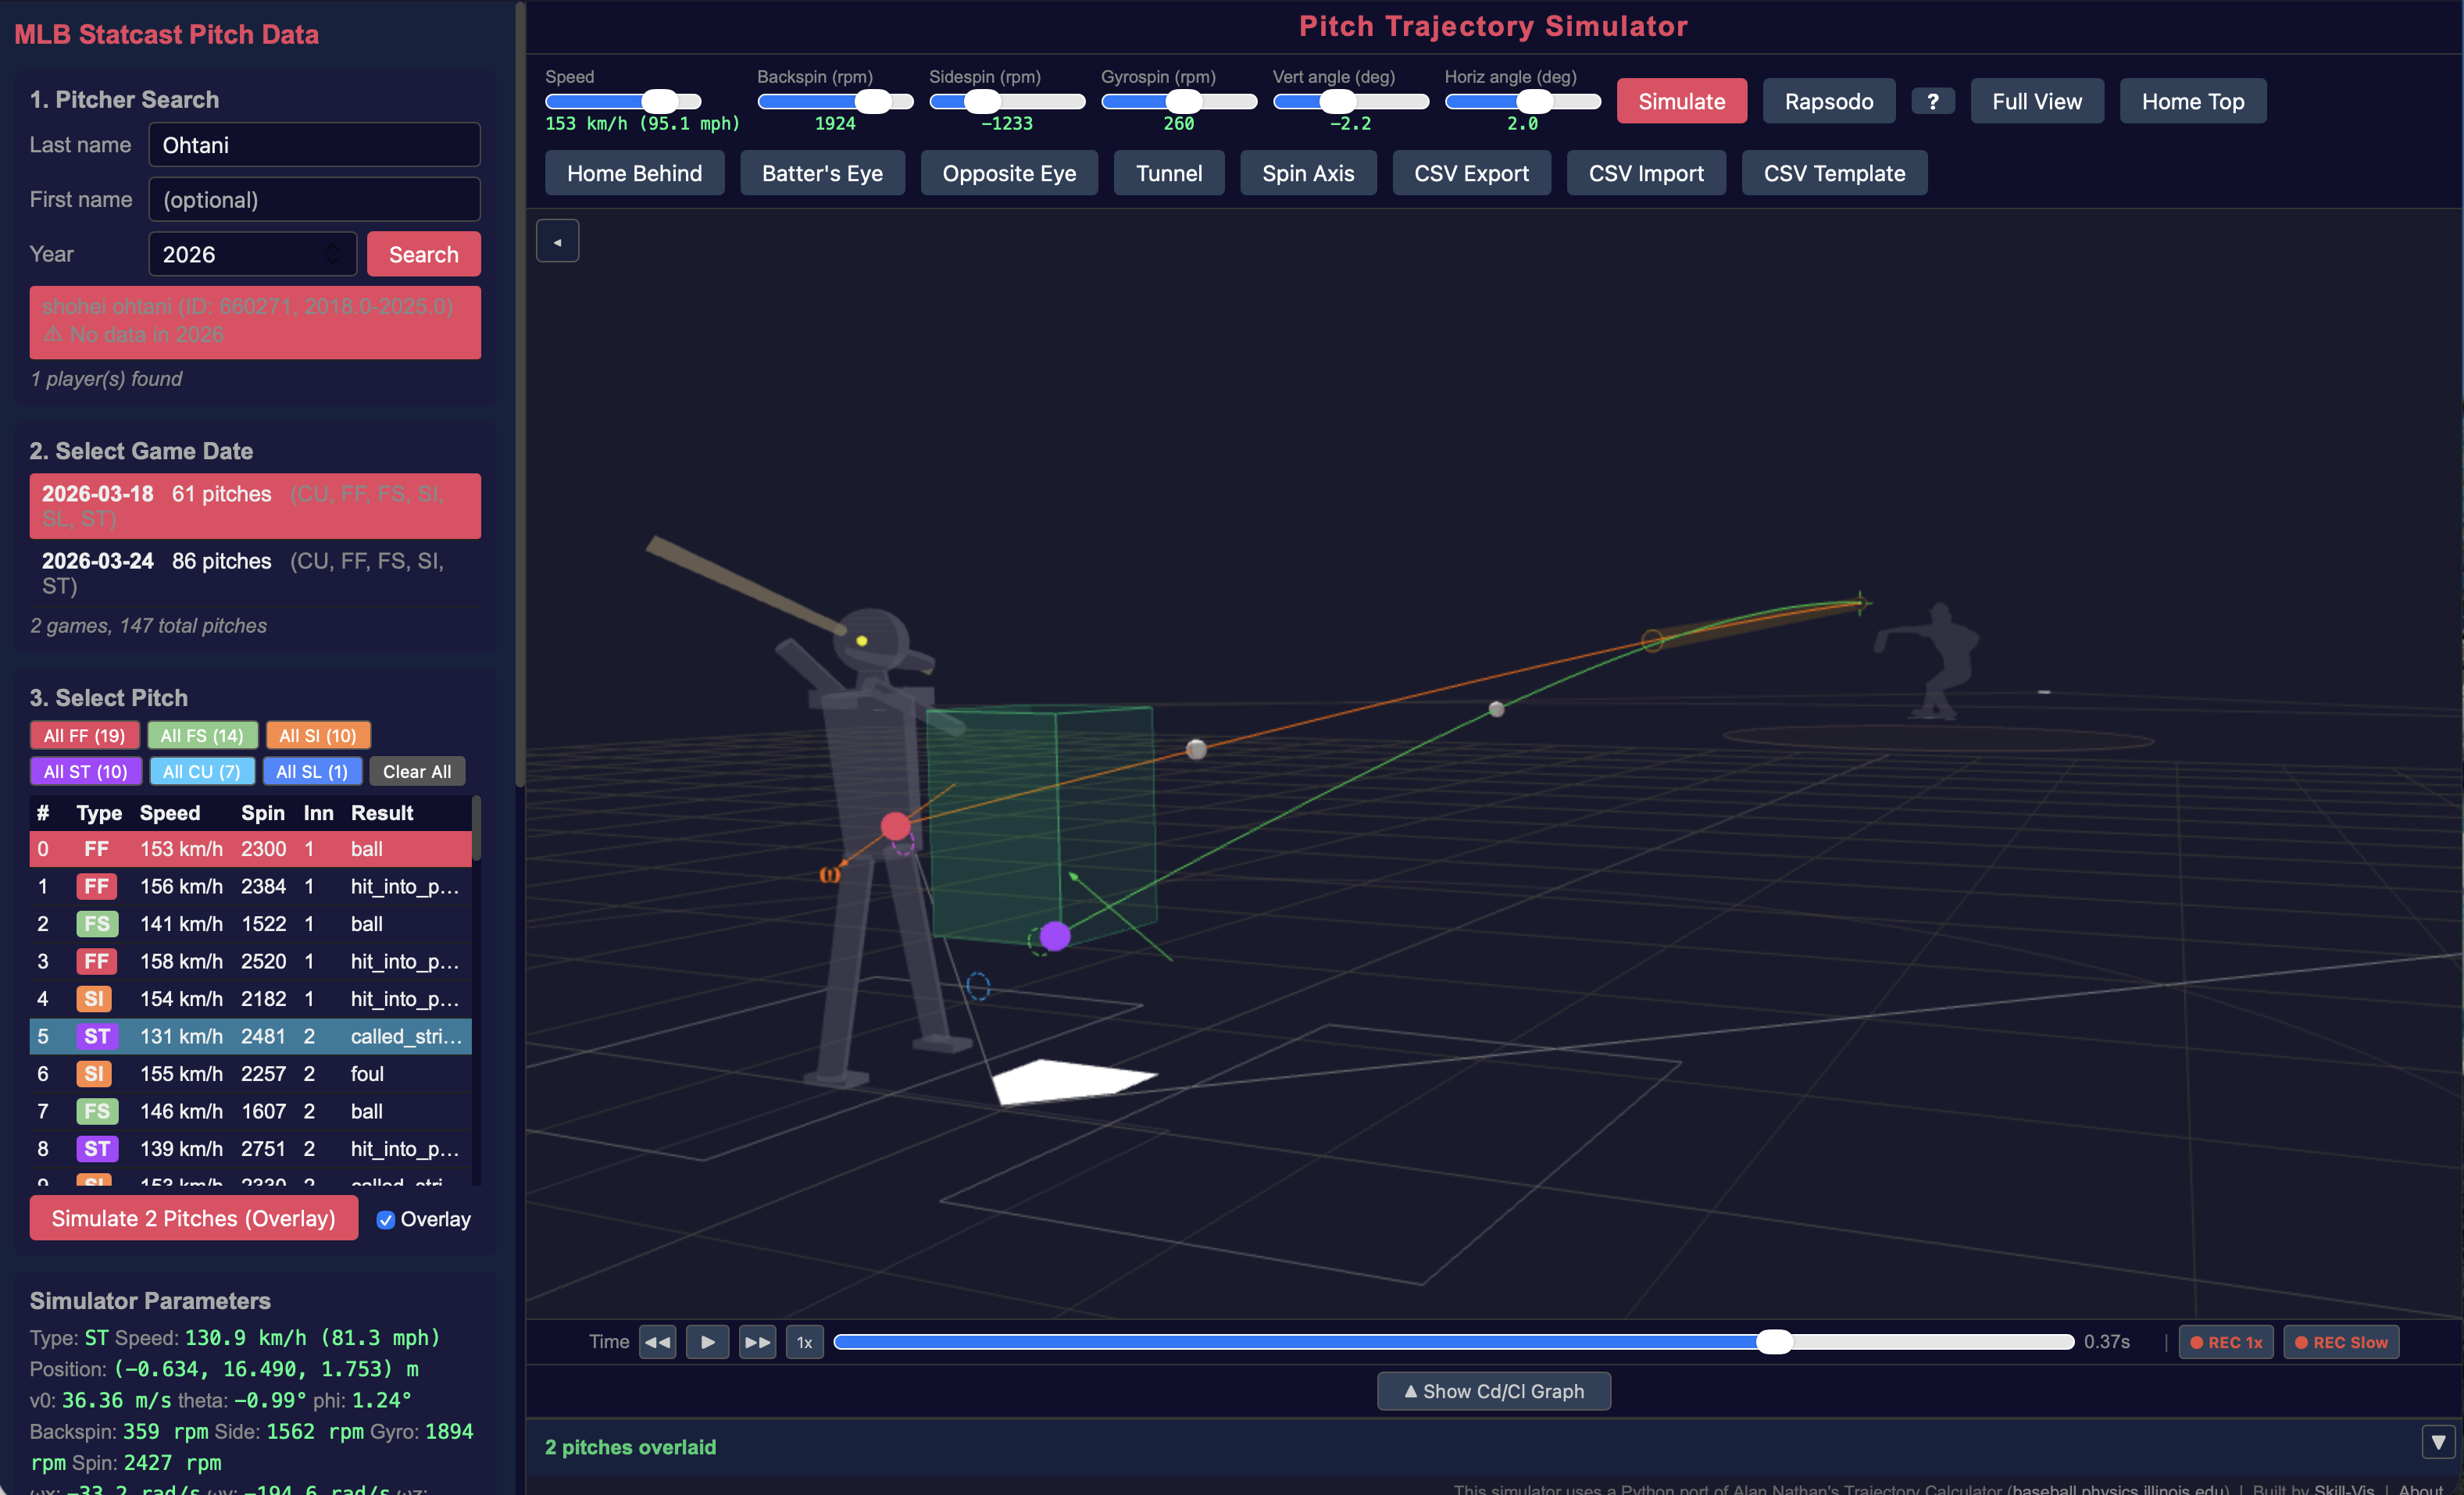
Overlay mode lets you simulate multiple pitches and display their trajectories simultaneously. This is the core feature for pitch comparison — tunneling analysis, pitch design evaluation, and consistency checks.
Turning On Overlay
Check the Overlay checkbox next to the Simulate button. Once enabled:
- The first pitch clears the view and draws normally
- Each subsequent pitch adds its trajectory on top, in a different color
Selecting Multiple Pitches at Once
When viewing a game’s pitch list, you can select multiple pitches:
| Action | Effect |
|---|---|
| Cmd/Ctrl + Click | Toggle individual pitches on/off |
| Shift + Click | Select a range |
| “All FF (12)” button | Select all pitches of a type |
| “Clear All” button | Deselect everything |
When multiple pitches are selected, the Simulate button changes to “Simulate N Pitches (Overlay)”. Click it, and all selected pitches are simulated sequentially with automatic overlay.
Selecting more than 30 pitches triggers a confirmation dialog. Each pitch requires an API call, so large batches take time.
Animated Playback
When overlaying multiple pitches:
- Up to 3 balls animate simultaneously during playback
- Each ball is a textured baseball rotating at its real angular velocity
- Balls are time-synchronized — a 155 km/h fastball arrives at home plate before a 130 km/h curveball
- After the fastest ball arrives, playback continues until the slowest ball reaches home plate
- Frame stepping (← → keys) covers the full time range including slower overlay balls
Overlay Statistics
After overlaying 2 or more pitches, the Overlay Statistics panel appears in the left panel (scroll down). It shows:
Input Parameters
- Speed, release position, angles, BSG spin components, angular velocity (ωx, ωy, ωz), |ω|, component ratios
Simulation Output
- Home plate crossing, spin movement, Statcast comparison, tunnel point
Statcast Measured
- SC Move Horiz/Vert (cm) — the actual Statcast-measured spin movement (pfx)
All values show Mean ± σ, Min, Max. The section is collapsible.
CSV Export with Statistics
When you click CSV Export with overlay data:
- The summary CSV includes one column per pitch, plus Statistics rows (mean, std, min, max) at the bottom
- The trajectory CSV includes all pitches side by side
Tips
- Overlay FF + ST to evaluate fastball-sweeper tunneling
- Overlay all FF in a game to check fastball consistency (look at standard deviation)
- Use Batter’s Eye view with overlay to see the pitches from the hitter’s perspective
- The Tunnel button shows the 23.8-ft tunnel cylinder for each pitch