Pitch Tunnel Visualization
Visualize the 23.8-ft tunnel where the batter decides
Overview
The Tunnel feature shows where each pitch crosses the 23.8-ft decision point — the last moment the batter can change their swing decision.
Turning On the Tunnel
Click the Tunnel button in the toolbar. It toggles on/off (green = on).
What You See
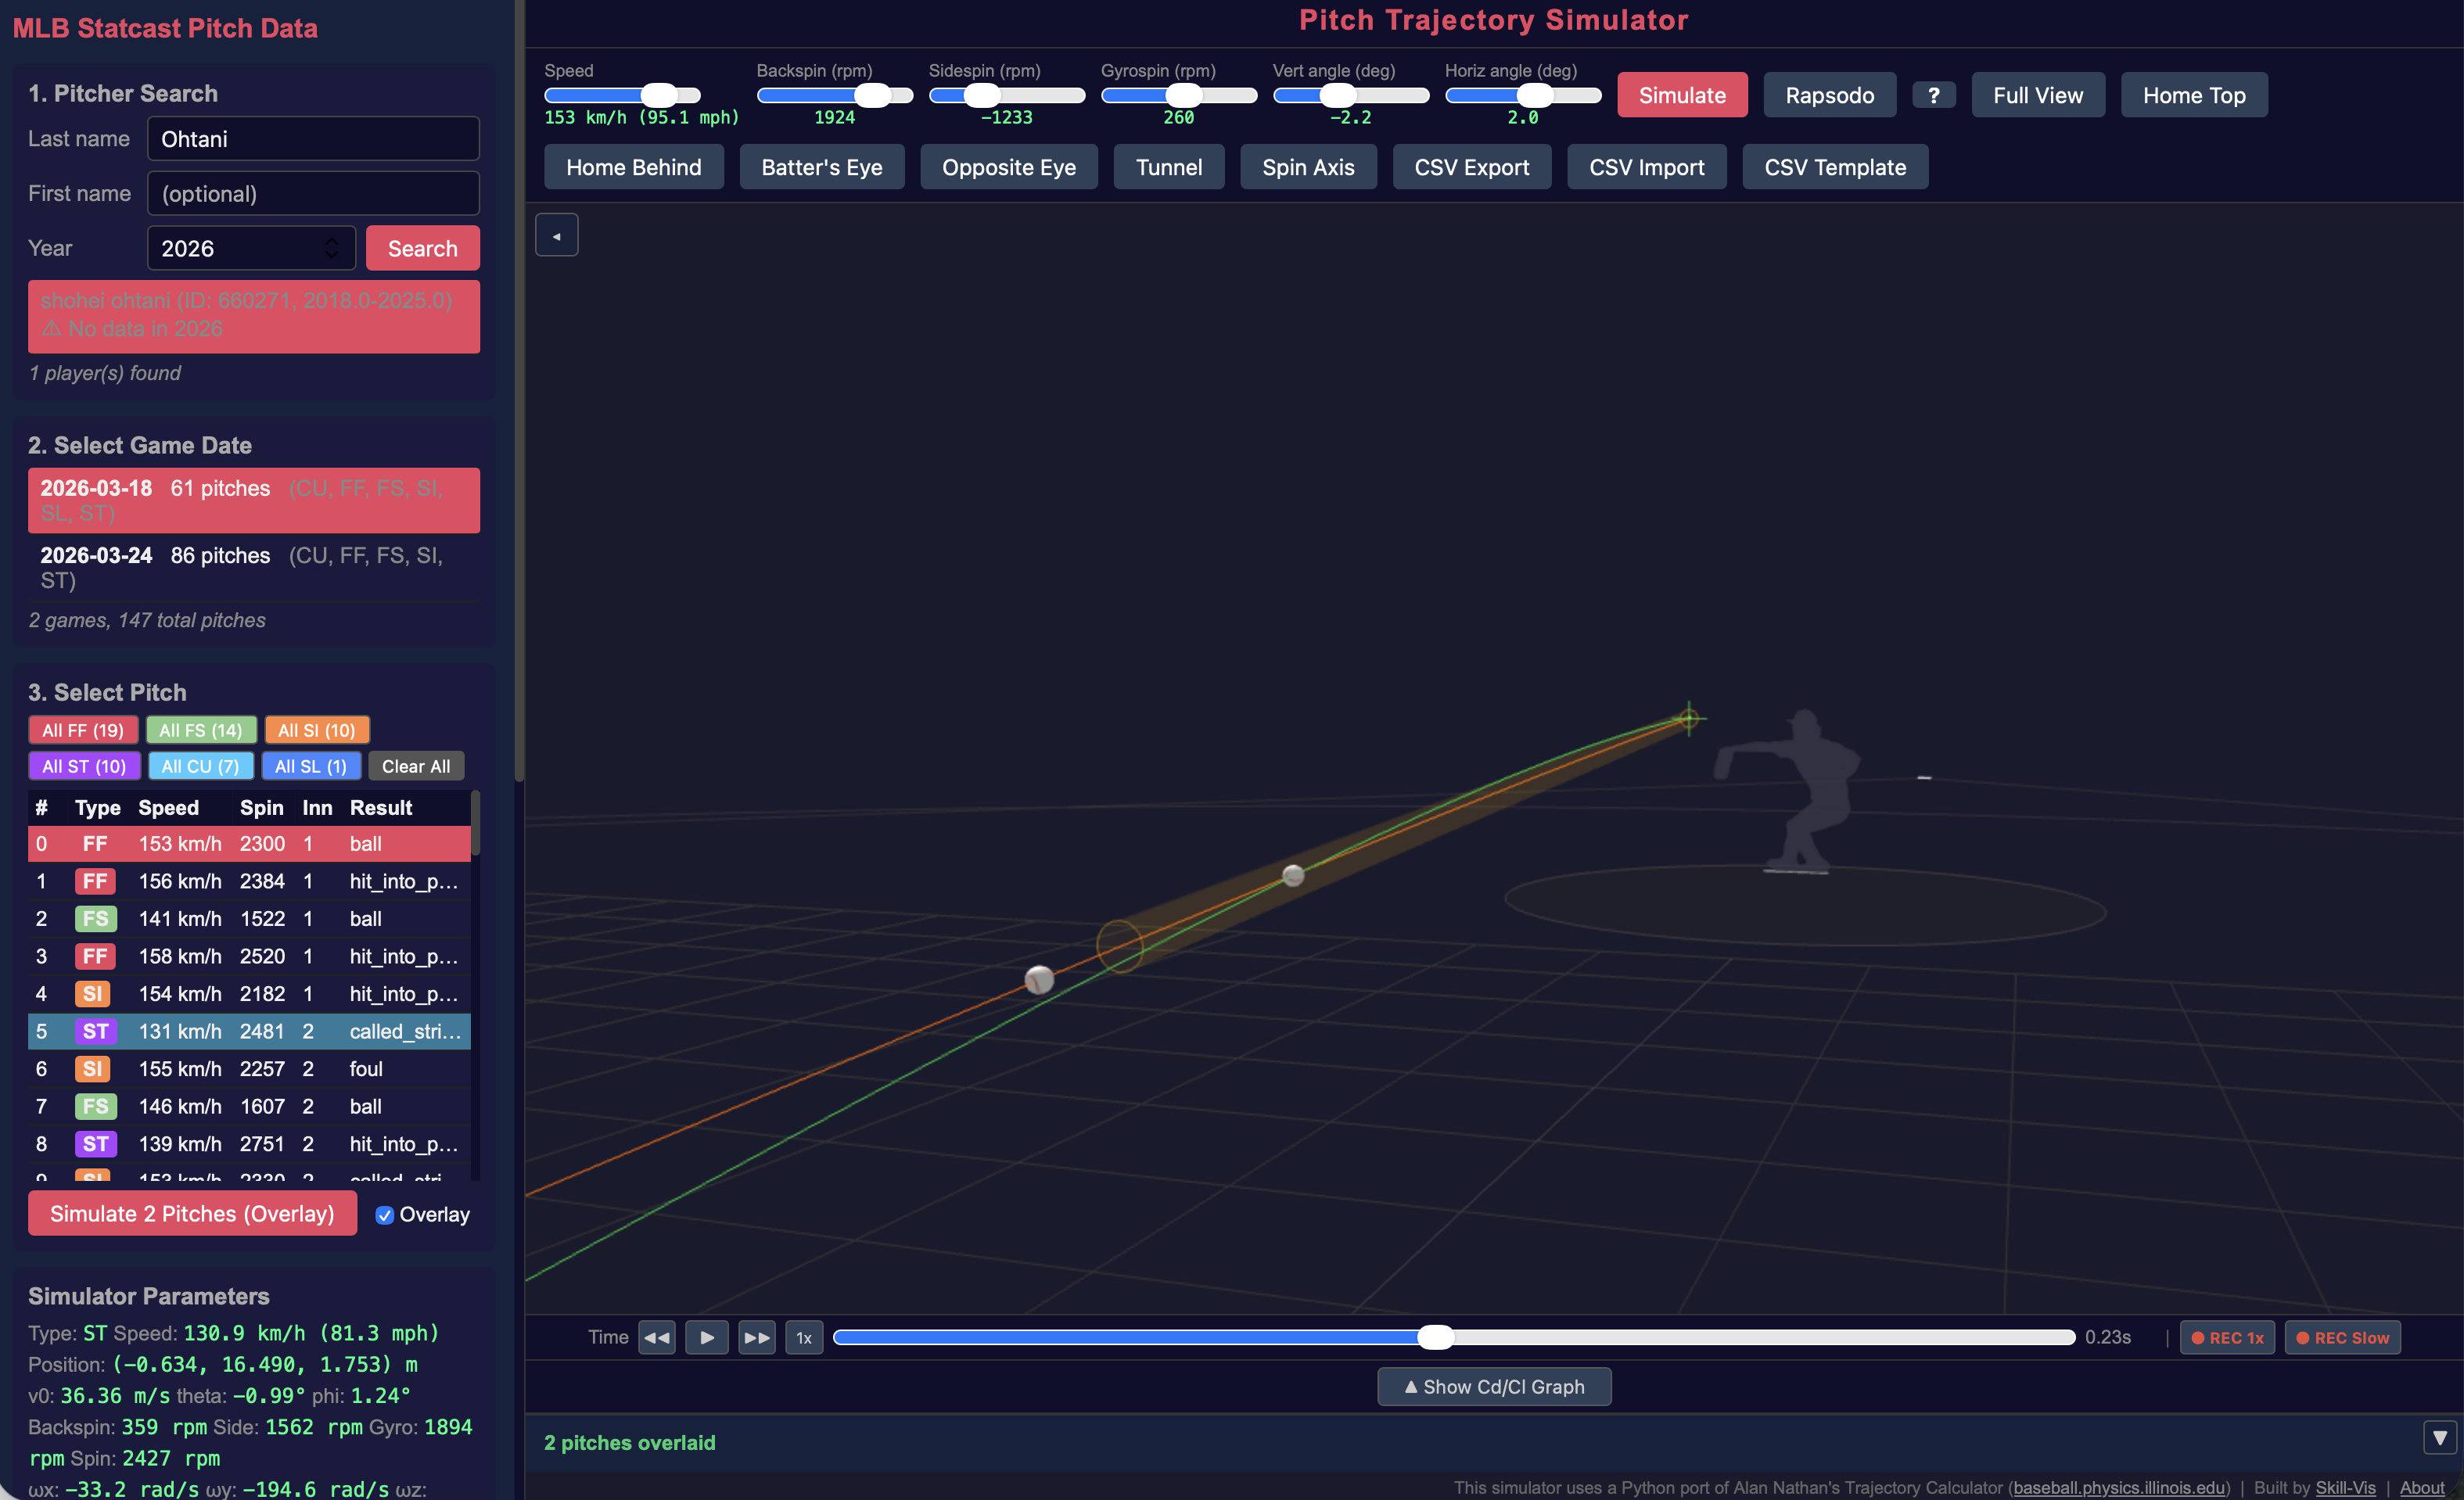
When Tunnel is enabled, the 3D view shows:
- Yellow rings — one at the release point and one at the 23.8-ft crossing point
- Transparent yellow cylinder — connecting the two points, showing the “tunnel” corridor
When you overlay multiple pitches, each pitch gets its own tunnel cylinder. If the 23.8-ft rings overlap, those pitches tunnel well.
Reading the Tunnel Data
The left panel shows the tunnel crossing coordinates:
● Tunnel (23.8ft) x=-0.404m, z=1.410mThis is the ball’s position when it crosses the 23.8-ft plane. Compare these coordinates across overlaid pitches — the closer they are, the better the tunnel.
Tunnel + Overlay: A Practical Example
Ohtani’s FF vs ST (2026-03-24)
- Search “Ohtani”, select 2026-03-24
- Select pitch #7 (FF, 97 mph) — Simulate with Overlay checked
- Select pitch #83 (ST, 81 mph) — Simulate
- Enable Tunnel
These two pitches have a release angle difference of only 0.234°. Despite a 16 mph speed difference, they pass through nearly the same point at 23.8 ft.
Senga’s FF vs FO (2026-03-19)
- Search “Senga”, select 2026-03-19
- Select pitch #54 (FF, 95 mph) — Simulate with Overlay
- Select pitch #30 (FO, 87 mph) — Simulate
- Enable Tunnel and Batter’s Eye
Release angle difference: only 0.095°. The forkball (“ghost fork”) looks identical to the fastball at the decision point.
Tips
- The tunnel visualization works in all view modes including Batter’s Eye
- Use frame stepping (← → keys) to pause the animation at exactly the tunnel crossing point
- The tunnel cylinder radius is approximately 2× the ball diameter — representing the area where the batter cannot reliably distinguish between pitches